Waterfall
The waterfall display (or waterfall spectrogram) has become one of the most important tools in modern amateur radio, particularly with the widespread adoption of SDR (Software Defined Radio) receivers and digital modes. It is not merely a graphical convenience, but a genuine paradigm shift in the way radio signals are observed, analyzed, and interpreted.
In a waterfall display, the horizontal axis represents frequency, while the vertical axis represents time. Signal intensity is encoded through color or brightness. Unlike a conventional instantaneous spectrum display (which shows only “what is there right now”), the waterfall allows the operator to observe the evolution of signals over time, making patterns, modulations, and dynamic behaviors immediately visible that would otherwise be difficult to detect.
From an amateur radio perspective, this tool is already invaluable for everyday operating. The waterfall makes it possible to identify weak signals buried in noise because, even when the instantaneous amplitude is insufficient to produce a clearly visible peak in the spectrum, persistence over time creates a visible trace. This is particularly useful on the HF bands, where ionospheric fading can make signals highly variable. The human eye is far more effective at recognizing a continuous or recurring trace than interpreting a single noisy instant.
Another crucial aspect is the ability to quickly distinguish between different types of emissions. On a waterfall display, a CW signal appears as a thin line that turns on and off; an SSB signal appears broader and more diffuse; digital signals tend to exhibit regular and repetitive structures. This allows the operator to visually classify band activity without even listening to it, making the search for interesting signals far more efficient.
When moving to digital modes, the waterfall becomes even more important because many of these modes are specifically designed to be recognizable at the spectrogram level. Modes such as FT8, FT4, PSK31, RTTY, and Olivia exhibit distinctive visual signatures: narrow bandwidths, regular timing sequences, and synchronized transmission patterns. An experienced operator can identify the modulation type, occupied bandwidth, and even the state of a communication simply by observing the waterfall.
 Info
InfoAn excellent catalog of signal types, complete with waterfall images and audio samples, useful for identifying transmissions, is available at [www.sigidwiki.com](http://www.sigidwiki.com).
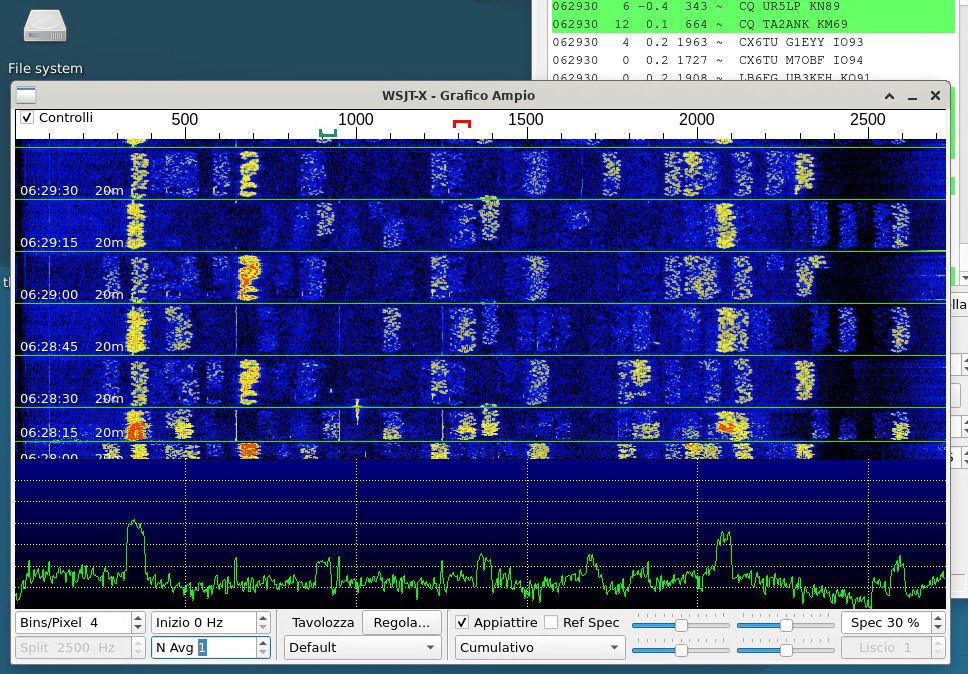
In the specific case of synchronized time-slot modes such as FT8, the waterfall clearly shows transmission and reception windows, with blocks of signals appearing at regular intervals. This helps operators immediately understand the rhythm of the protocol and position themselves correctly within the passband without interfering with other signals. Furthermore, the distribution of signals across the audio passband provides an immediate indication of band occupancy and helps identify clear frequencies more effectively.
From a signal analysis standpoint, the waterfall provides information that goes beyond simply detecting the presence of a signal. It allows operators to observe frequency drift, oscillator instability, Doppler effects (for example in satellite communications), and distortions introduced by the propagation channel. A signal that bends or wavers over time may indicate frequency instability; a signal that widens can suggest overdriving or non-linear modulation. These details are invaluable both for diagnosing one’s own station and for evaluating propagation conditions.
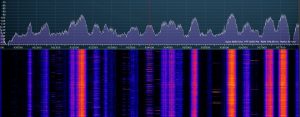
Spectrum and waterfall display (8 MHz span) from an SDR receiver.
An additional advantage of the waterfall is its ability to reveal phenomena that would otherwise remain unnoticed, such as burst signals, intermittent transmissions, or low-probability-of-intercept protocols. Even very brief or sporadic signals leave a visible trace, allowing operators to detect activity that might escape purely audio monitoring or instantaneous spectrum analysis.
In an educational context, the waterfall is also an extraordinary tool for understanding theoretical concepts such as bandwidth, modulation, interference, and noise. Seeing directly how a modulation occupies spectrum space, or how two signals interfere with one another, makes concepts that might otherwise remain abstract immediately tangible.
Finally, with the widespread use of SDRs and remote receiving systems, the waterfall has also become a collaborative tool. Many online platforms allow operators to observe radio spectrum activity in real time from different parts of the world, turning the waterfall into a shared “window” on global propagation. This opens new opportunities for studying ionospheric conditions and coordinating activity among operators.
In summary, the waterfall display is far more than a visualization method: it is a powerful analytical instrument. In modern amateur radio, particularly in the field of digital modes, it allows operators to see what the ear cannot hear, recognize what cannot yet be decoded, and gain a deeper understanding of how radio signals behave across both time and frequency.
In the photograph: the WSJT-X spectrum and waterfall window, showing FT8 activity on 14.074 MHz.
Post Comment